Поиск книг, учебников, пособий в онлайн-магазинах

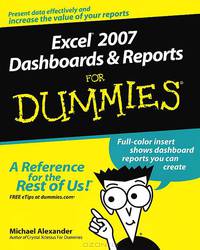
Excel 2007: Dashboards & Reports For Dummies
Автор: Michael Alexander, 344 стр., издатель: "Wiley Publishing, Inc", ISBN: 978-0-470-22814-2, 9780470228142Create dashboards that communicate and get noticed Use pivot tables and form controls to build reports that mean something What?s the use of putting out reports that no one bothers to read? Properly created dashboards are graphical representations that put data in a context for your audience, and they look really cool. You?ll find out when you see the examples in this book, and soon your dashboards and reports will be getting rave reviews. Discover how to: Think about your data in a new way Create dynamic labels that support visualization Represent time and seasonal trending Display and measure values versus goals Give users an active interface
| Под заказ: | ||||
|
|
OZON.ru - 2595 руб. |
Перейти 
|
||
Рейтинг книги: 


 5 из 5, 4 голос(-ов).


 5 из 5, 4 голос(-ов).


